Report Books
Servicetrace® Report Automation enables Service reports to be created automatically at defined points in time
and to be saved as a Report Book.
A report book contains the measurements of one or multiple Service
reports, taking into consideration the Service Conditions of the underlying Services. It can be generated in
various formats and stored within the database or file System or sent by email.
Service reports that are to be
included in a report book must be set up beforehand in the Servicetrace® Reporting module.
A detailed description of the contents of a report book can be found here.
An overview of all report books for a selected Customer can be viewed in the Report Books table.
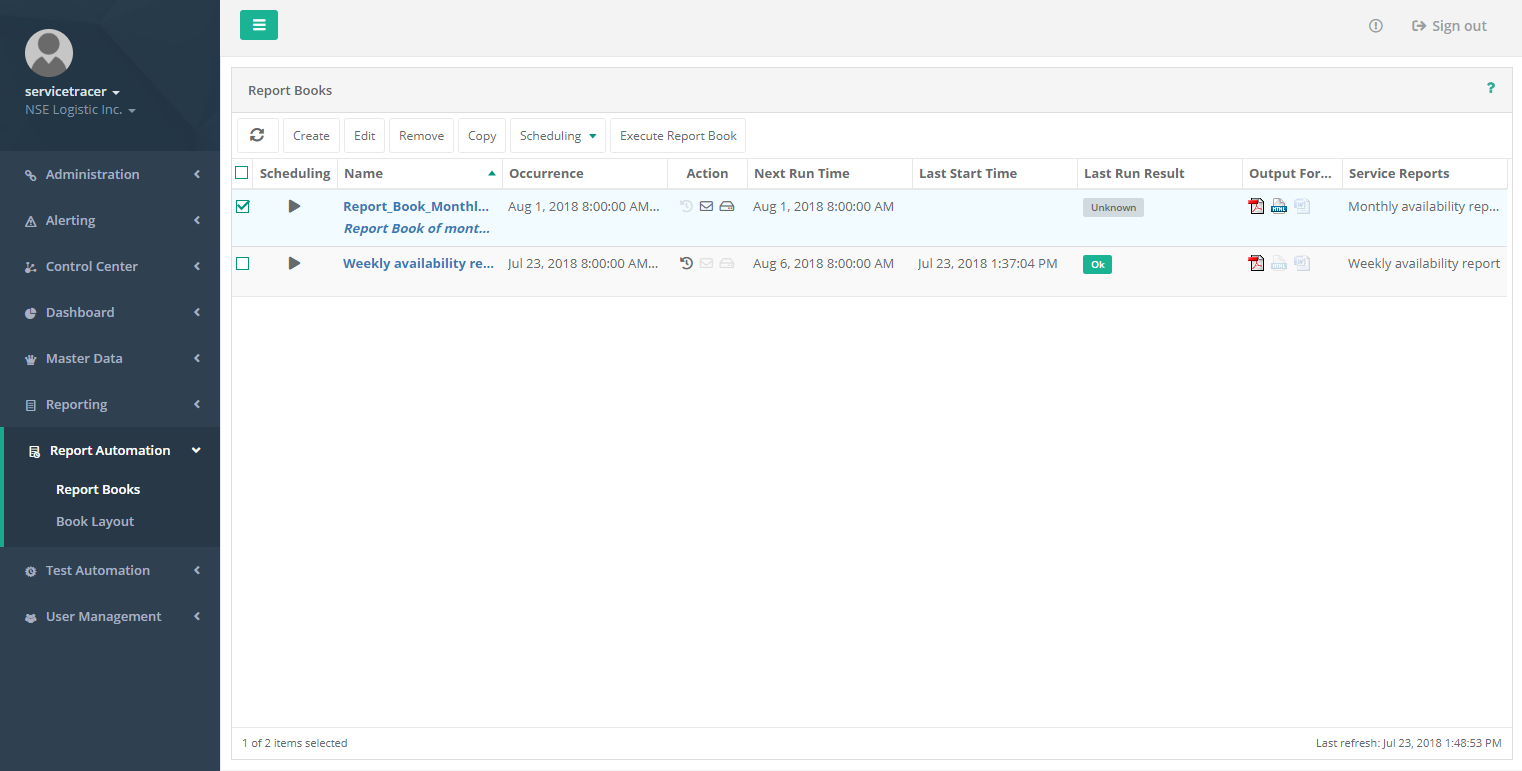
The Report Books table allows the following content to be displayed in columns:
| Scheduling | Enabled or disabled |
| Name | Name of the report book |
| Description | Description of the report book |
| Occurrence | Time of generating the first and subsequent output versions of the report book |
| Action | Output type for the report book:
|
| Next Run Time | Time the next report book will be generated |
| Last Run Time | Time the last report book was generated |
| Last Run Result | Outcome when generating the last report:
|
| Output Formats | Output format of the report book:
|
| Service Reports | The Service reports that the report book contains |
| Time Zone | Time zone for the report book – all times shown are converted to this time zone |
User
The following privilege allows users to open the Report Automation
application: Report Automation Management Open. To open a report book, the user must
additionally hold the following privilege: Service Report Management Open.
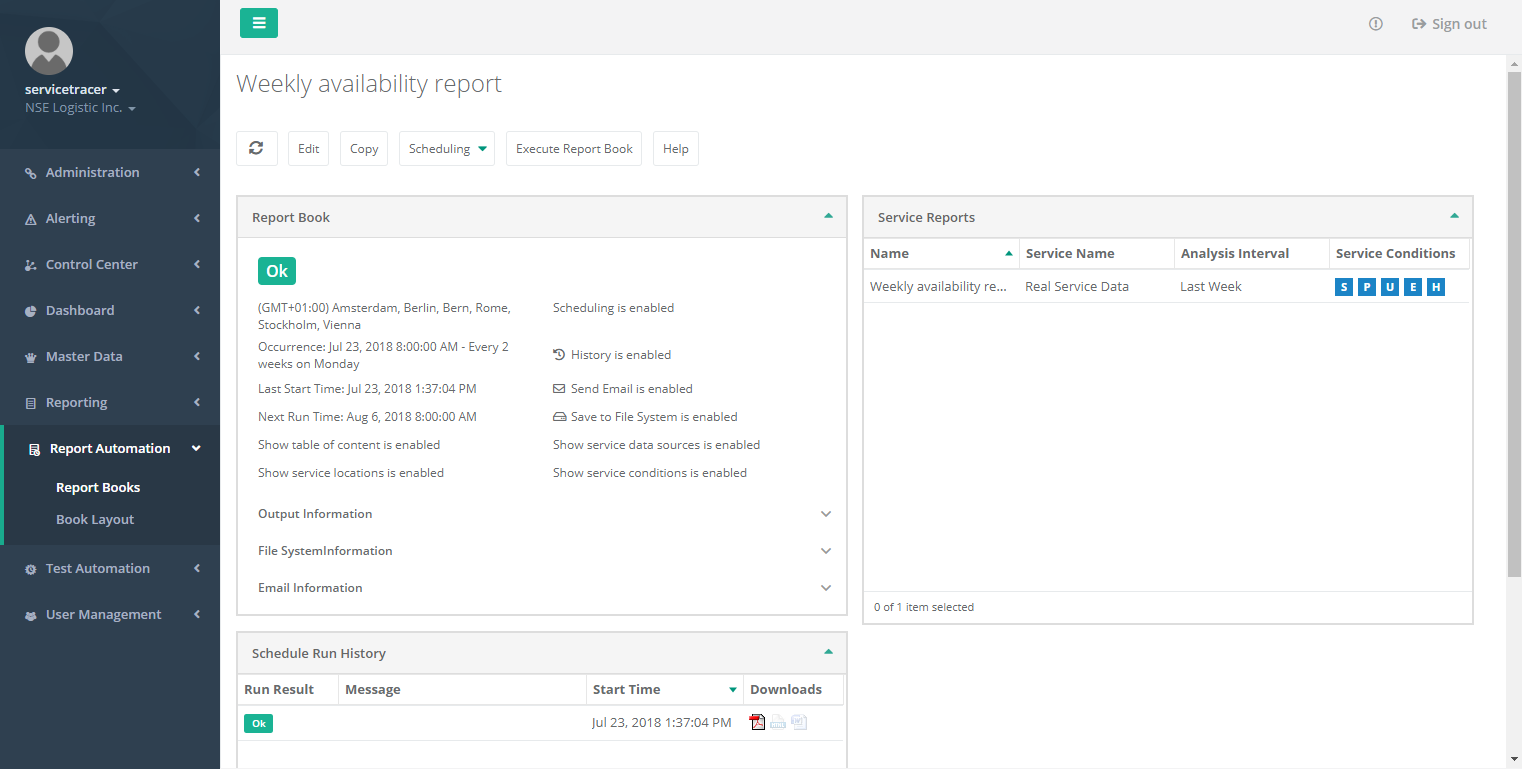
Detailed View
Click on the name of a report book to see more details. Report books which can be selected are highlighted when you hover the mouse over them. The detailed view shows the underlying Service reports, settings, and output versions of the selected report book.
Implemented as a portal, the detailed view consists of multiple small windows (portlets), which can be rearranged using drag and drop. Click on the small arrow in the upper right corner of each portlet to minimize it or to expand it again.
There is a menu on the left of the detailed view for switching to the detailed view of another report book for the same Customer.
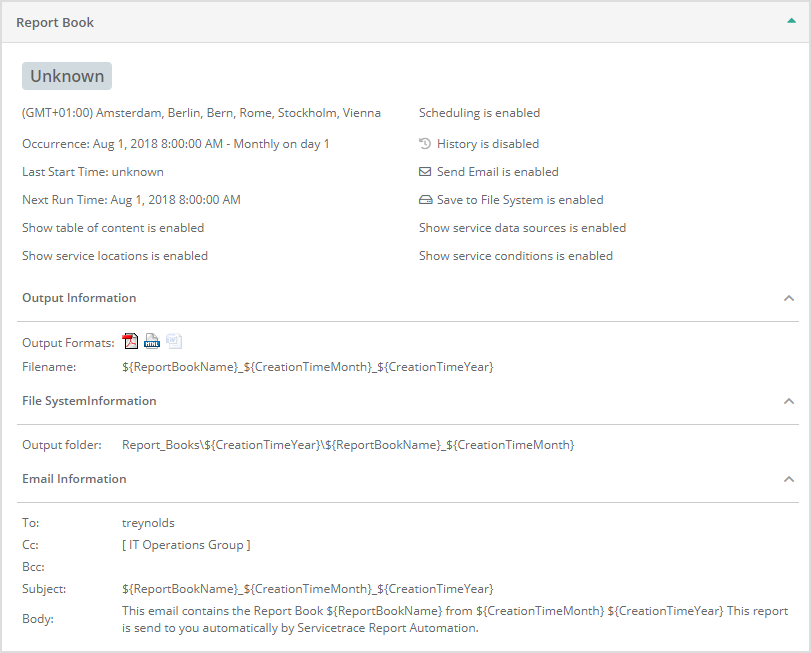
Detailed View - Report Book
The Report Book portlet presents information about scheduling and outputting a report book. Output details can be shown or hidden by clicking on the plus or minus symbol.
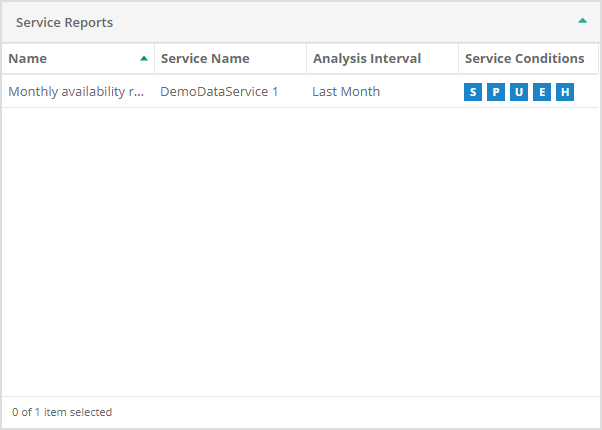
Detailed View - Service Reports
The Service Reports portlet lists information about the Service report that underlies the report book.
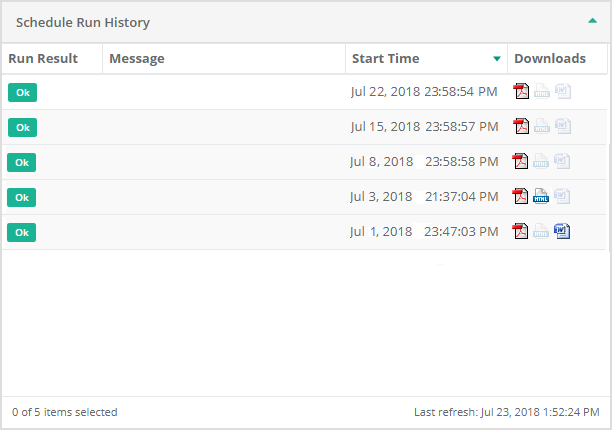
Detailed View - Schedule Run History
The Schedule Run History portlet lists all previous output versions (executions) of the report book. If the Save History option has been enabled under Action, the various report books can be downloaded by clicking on the relevant symbol in the Downloads column of the Schedule Run History table. The file will be saved on the user's PC according to his web browser's download configuration.
Multitenancy
Report Books are created for the Customer currently selected.
Standard users can only see report books for
the Customer they are associated with.
System users may freely select Customers.
After selecting a Customer using the Customer Switch,
work carried out by the System User is performed in the context of that Customer.
New report books created by
System users are then associated with the selected Customer for use by that Customer's users.
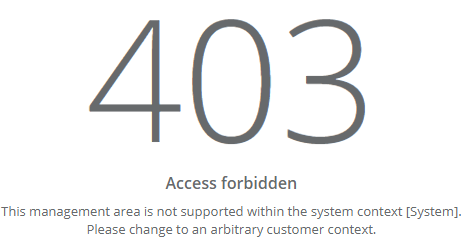
Caution: The System context does not support any report books. If the System context [System] is selected under the Customer Switch, the following message will appear:
Menu
The Report Books overview contains the following menu items:
 Refresh
This menu item updates the list of report books. The table's status bar shows the time stamp of the last refresh.
Create
This menu item creates a new report book. A more detailed description can be found in the Creating a Report Book section.
User
This menu item is only available to users with the following privilege: Report Book Create / Edit.
Edit
All report book parameters can be modified later using this menu item.
User
This menu item is only available to users with the following privilege: Report Book Create / Edit.
Remove
If a report book is no longer required, it can be removed from the System using this menu item.
User
This menu item is only available to users with the following privilege: Report Book Delete.
Copy
This menu item can be used to copy an individual report book and save it under a different name. Use Edit to make any changes to the report book you have copied.
User
This menu item is only available to users with the following privilege: Report Book Create / Edit.
Scheduling Enable
This menu item launches scheduling for one or more report books. If scheduling is recommenced following a pause, the missed runs are not repeated. The next run will take place according to the Schedule that has been predefined.
User
This menu item is only available to users with the following privilege: Report Book Create / Edit.
Scheduling Disable
This menu item pauses scheduling for one or more report books. If scheduling is recommenced following a pause, the missed runs are not repeated. The next run will take place according to the Schedule that has been predefined.
User
This menu item is only available to users with the following privilege: Report Book Create / Edit.
Execute Report Book
This menu item generates a report book immediately. The function is performed independently of the scheduling for that report book. Scheduling does not need to be set to Enabled for this to work.
Creating a Report Book
The first step in this wizard is to specify a name and time zone for the new report book. All the data contained in this report book will be converted to the specified time zone. An optional description of the contents of the report book can be added and will be shown on all overview pages, making it easier to identify the report book.

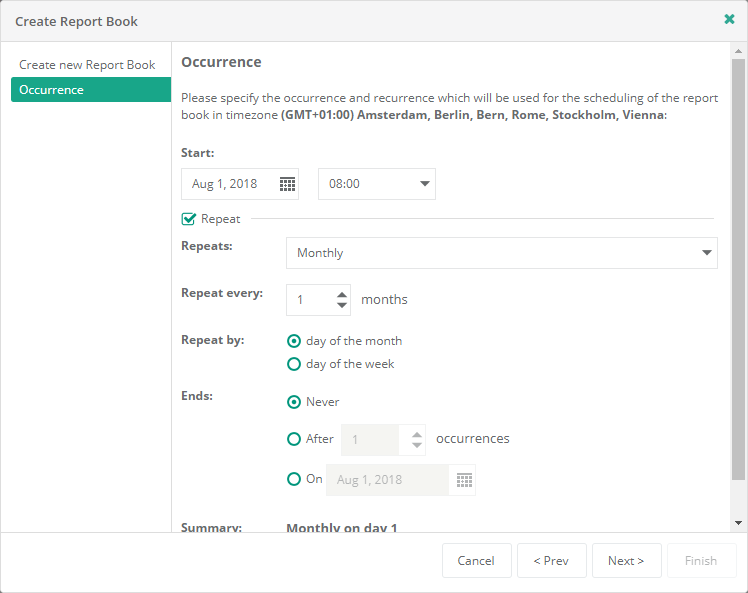
The point in time when the report book will be generated is defined on the Occurrence page. If the Repeat
checkbox is selected, the report book can be generated regularly at any interval.
The analysis interval refers
solely to generating the report book. The analysis interval for the reports contained within the report book is specified
in the relevant Service report.
If you would like to learn more about the concept of time zones in the Central Server System and how these are shown across the Service, a detailed description is provided here.
The Select Service Reports page is for selecting all the Service reports that are to be included in the report book.

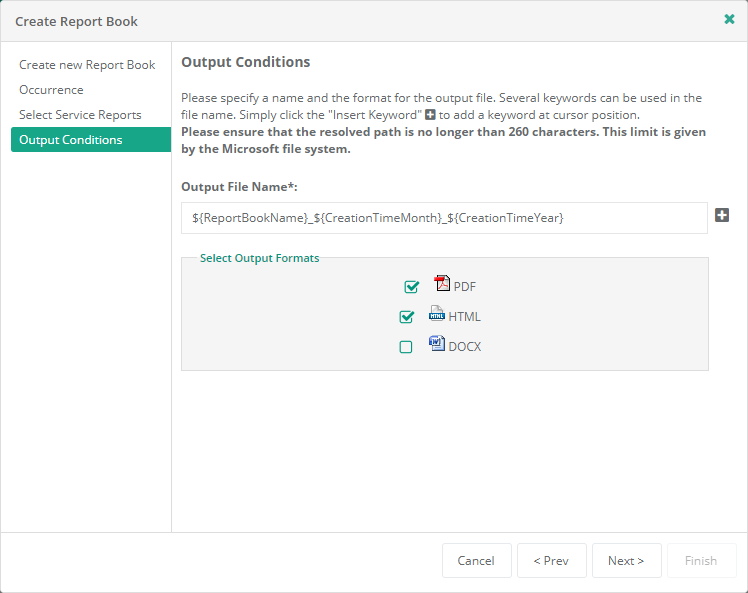
On the Output Conditions page, a name is specified for the output files and the desired output format selected.
The name of the output file may contain keywords. You can find a detailed description of keywords here.
The possible output formats are:
- HTML
- DOCX
The layout of the output file is defined in the Book Layout view within the Report Automation.
The Action page is used to specify what happens with the report book after it is created.
Save
History saves the documents that are generated in a database. You are then able to download them from the detailed view
of the report book in the Schedule Run History table. More information is provided here.
Please note that selecting this option may cause the
database to grow rapidly.
The report book can also be sent as an email attachment. The relevant
details for this are entered on the Email Settings page.
If the report book will be stored in the file System on the Central Server server, a folder with
appropriate write permissions must be created and assigned to the report book Customer. Details about what is known as
the Customer Folder are provided here.

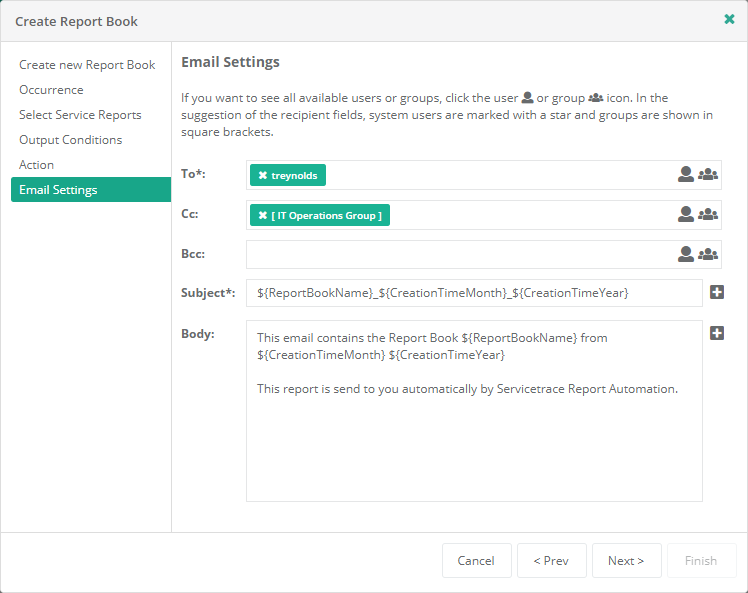
If the option Send Email is selected on the Action page, the information
required to actually send the email must be entered on the Email Settings page.
Recipient addresses can
be entered manually or selected from a list of all users or mail groups.
Keywords may be inserted into the subject line and body of the email.
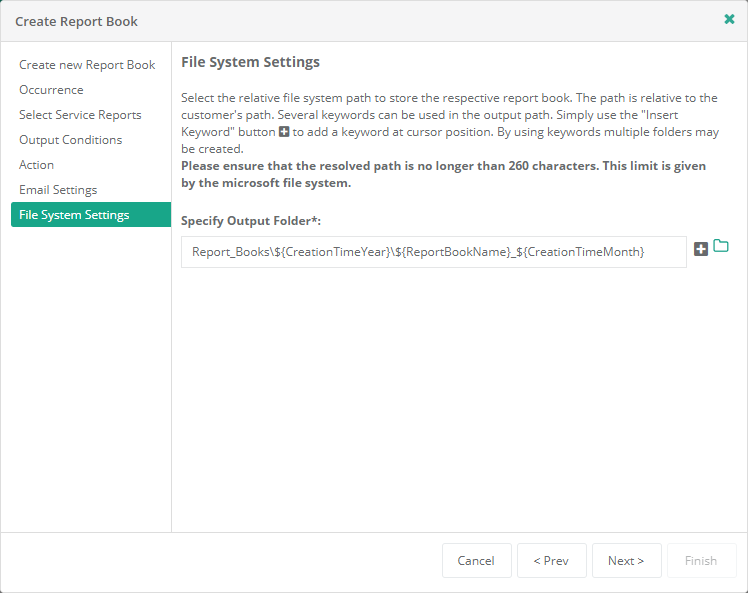
If the option Save to File System is selected on the Action page, the Location must be specified on the File System Settings page. The output folder is relative to the Customer folder and may contain Keywords.
Please make sure that the Customer folder path length does not exceed 260 characters. This limit is set by the Microsoft file system.
To save a report book in the file system, the user running Central Server must have write permissions for the Customer folder. If nothing is changed after installation, this user is the System User and holds the required write permissions. If you have changed something here, please make sure that the user running Central Server has write permissions for the Customer folder so that report books can be saved in that Location.
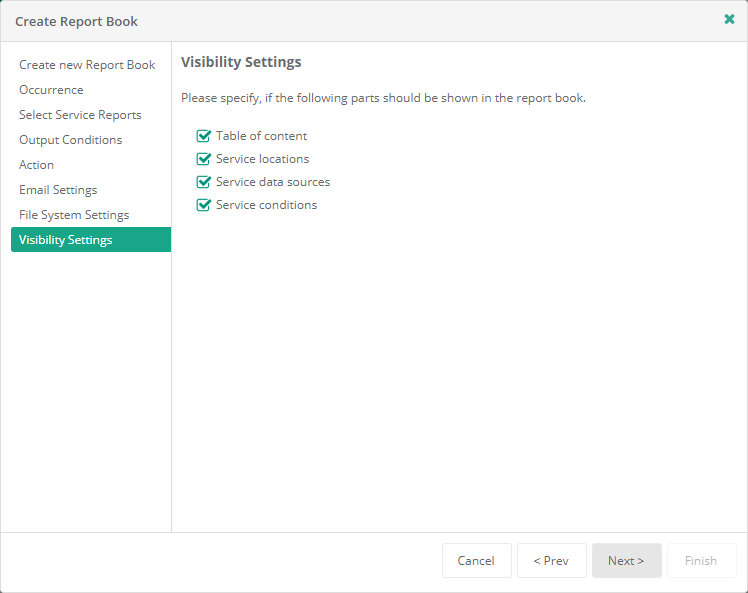
On the page Visibility Settings you can choose if the following parts should be shown in the report book:
- Table of content
- Service locations
- Service data sources
- Service conditions
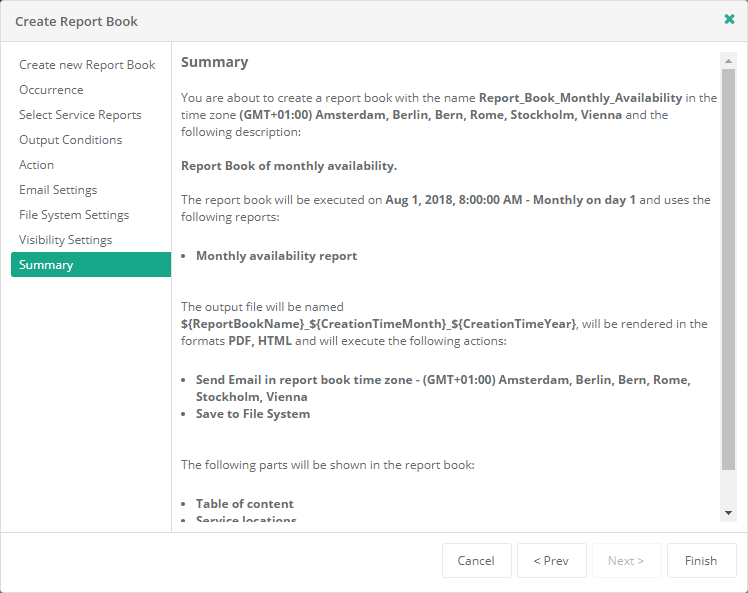
The last page in the wizard provides a summary of the report book parameters you have selected. If necessary, you can make corrections on the relevant pages or click "Finish" to confirm and create the report book.
Keywords
The name and path of a report book may contain Keywords which are set up when the report book is created.
The following keywords are available:
| ${ReportBookName} | Name of the report book that will be created |
| ${CreationTimeYear} | Year when the report book was created |
| ${CreationTimeMonth} | Month when the report book was created |
| ${CreationTimeDay} | Day when the report book was created |
| ${CreationTimeHour} | Hour when the report book was created |
| ${CreationTimeMinute} | Minute when the report book was created |
| ${CreationTimeSecond} | Second when the report book was created |
| ${CreationTime} | Time when the report book was created in ISO 8601 format |
Contents of a Report Book
The report book contains all the widgets relating to the selected Service report. The sequence for these widgets is taken
from the user interface of the relevant Service report. Analysis intervals and Service conditions also match the settings
for the underlying Service report. The sections below outline specific features of some of the widgets relating to the
report book.
Details of Service report widgets are provided here.
Availability Summary
The Availability Summary widget contains the following columns in the report book:
- Checkpoint
- Location
- Availability (%)
- Count
- Success
- Error
Availability per Checkpoint
Unfortunately it is not possible to assign the markers of this line graph to the associated bars in the bar chart.
If the same number of values has been collected for all checkpoints shown, the individual statistical series in the line
graph are layered on top of one another. This gives the impression that only one statistical series is being displayed.
Availability per Location
Unfortunately it is not possible to assign the markers of this line graph to the associated bars in the bar chart.
If the same number of values has been collected for all checkpoints shown, the individual statistical series in the line
graph are layered on top of one another. This gives the impression that only one statistical series is being displayed.
Response Time Summary
The Response Time Summary widget contains the following columns in the report book:
- Timer
- Location
- Count
- Min.
- Average
- Max.
Response Time per Location
If more data is measured in the respective analysis interval than there are pixels in the graph, the data will be
aggregated in a visual representation. The aggregation algorithm for this can be configured.
Based on an
aggregation interval, the following algorithms are available:
- Maximum
- Average
- Minimum
- Open (first value in the aggregation interval)
- Close (last value in the aggregation interval)
Aggregated Response Time per Location
In contrast to the widget Response Time per Location, all values are shown in the chart and are not further aggregated. In addition to that all data is displayed in a table as well.
Based on an
aggregation interval, the following algorithms are available:
- Maximum
- Average
- Minimum
- Open (first value in the aggregation interval)
- Close (last value in the aggregation interval)
Response Time per Timer
If more data is measured in the respective analysis interval than there are pixels in the graph, the data will be
aggregated in a visual representation. The aggregation algorithm for this can be configured.
Based on an
aggregation interval, the following algorithms are available:
- Maximum
- Average
- Minimum
- Open (first value in the aggregation interval)
- Close (last value in the aggregation interval)
Aggregated Response Time per Timer
In contrast to the widget Response Timer per Timer, all values are shown in the chart and are not further aggregated. In addition to that all data is displayed in a table as well.
Based on an
aggregation interval, the following algorithms are available:
- Maximum
- Average
- Minimum
- Open (first value in the aggregation interval)
- Close (last value in the aggregation interval)